Peak Shaving with Energy Storage: Industrial Batteries for Peak Load Management
Starting up a production line, turning on all the refrigeration compressors at once, or charging a fleet of forklifts can create a power spike in just a few minutes that drives up your entire annual electricity bill. From the grid’s perspective, it’s not how much energy you use in total that matters, but rather what your highest 15-minute load was. Peak shaving targets precisely those few minutes: you cover the peak with battery power, not from the grid.
In this article, we’ll walk through what peak shaving entails and why the 15-minute measurement interval is the true starting point for planning. Next, we’ll clarify the difference between kW and kWh, show you how to calculate the required discharge power, and explain how the C-rate and DoD determine battery size.
Finally, we’ll examine how peak shaving works with energy storage across different industrial load profiles, how much a power overrun actually costs, and when the investment pays off. Using the FoxESS TMax and TMaxPlus systems, we’ll also walk you through a specific sizing exercise in practice.
What Peak Shaving Means: How Battery-Based Peak Load Reduction Works
In practice, peak shaving means this: you trim the highest peaks of power drawn from the grid and make up for the shortfall with battery power. Your total energy consumption won’t decrease, but the maximum power recorded by the meter will.
This saves you money because industrial electricity bills are based on two separate charges. You pay the energy charge for the kilowatt-hours consumed, but the capacity charge is based on the highest kilowatt drawn. The grid tariff for commercial and industrial consumers is typically structured exactly this way: an energy charge based on kWh and a capacity charge based on kW, where the latter is proportional to the highest peak measured during the billing period.
Battery-based peak load reduction occurs in three steps. The energy storage system charges during periods of low load, either from the grid or from solar power generation. When consumption approaches the set threshold, the system automatically switches to discharge mode, and the battery covers the portion exceeding the threshold. The cycle repeats daily, and the energy management system continuously monitors consumption, charge level, and generation.
It’s important to distinguish this from load shifting, with which it is often confused. With load shifting, you simply move the consumption itself to a different time period—for example, by shifting fleet charging to nighttime. Peak shaving, on the other hand, does not alter the technological process: the machinery runs when it needs to; the peak simply disappears from the grid’s perspective. This is precisely why it works even in facilities where the production schedule cannot be adjusted.
Why is analyzing and reducing 15-minute power peaks important in peak shaving planning?
For industrial users billed on a time-of-use basis, the grid operator does not look at instantaneous values. The load curve consists of quarter-hourly data, and the maximum power drawn is the highest quarter-hourly average power recorded by the meter. This figure serves as the basis for the power charge, and the same 15-minute logic applies in European billing practices as well.
The result is that not every power surge is expensive. Consider a facility with a base load of 400 kW. If an additional load of 250 kW persists for 12 minutes, the quarter-hour average is 400 + 250 × (12/15) = 600 kW. If that same 250 kW lasts only 3 minutes, the average is just 450 kW. Same peak power, but a 150 kW difference in billing.
That is why every serious design project begins with downloading the T-curve. You’ll need at least 12 months’ worth of quarter-hourly data, which you can obtain from the grid operator or your utility provider. This data reveals how many peaks occur in a month, how long they last, and how much energy they contain.
Reducing the power peak depends on this data set. If the curve shows 30–40 short peaks that are far apart, you’ll need a system with low capacity but high power output. If, on the other hand, you see long plateaus that repeat daily, capacity will be the bottleneck. Without data, all sizing is guesswork, and a poorly set threshold can wipe out an entire month’s savings because of a single missed quarter-hour.
kW or kWh? The Role of Power and Energy Storage Capacity
These two numbers answer two different questions. A kilowatt tells you how much power the system can deliver at any given moment, while a kilowatt-hour tells you how long it can sustain that output. When planning for peak shaving, you need both—and one cannot replace the other.
The industry distinguishes between power-oriented and energy-oriented systems; the ratio between the two is the power-to-energy ratio. A 1 MW / 0.5 MWh system is half-hourly, meaning it is power-oriented. The cost structure is also split into two parts: the energy cost (per kWh) is determined by the cells, racks, and DC integration, while the power cost (per kW) is determined by the inverter, transformer, and high-current cabling. When requesting quotes, you must specify both separately; otherwise, the quotes will not be comparable.
The most common design mistake is thinking only in terms of kWh. A 200-kWh storage system seems like a lot on paper, but if its inverter can only deliver 50 kW, it won’t be able to handle a 120-kW peak. The reverse is also true: a 150 kW output is useless if the underlying capacity is exhausted after 20 minutes, and the quarter-hourly peak recurs several times a day.
The correct order is therefore: first, determine the required kW from the load curve, then calculate the kWh based on the duration of the peaks. The ratio of these two values gives the C-rate, which in turn determines the cells’ load capacity and service life.
How can the required discharge power for a peak shaving system be calculated?
The formula itself is simple: the required discharge power is the difference between the measured quarter-hourly peak and the set threshold value. You can calculate the capacity using the formula standard in this industry, where the required energy is the product of power and discharge duration, divided by the depth of discharge and the cycle efficiency. Do not reverse this order: kW is the input, kWh is the output.
Let’s look at a specific example. On the load curve, the highest quarter-hour average is 780 kW, and your goal is to stay below 600 kW. The required power is therefore 780 − 600 = 180 kW. The curve also shows that the longest peak event lasts 45 minutes, or 0.75 hours.
The useful energy is thus 180 × 0.75 = 135 kWh. However, this is not yet the capacity you need to purchase. If you calculate using a 90 percent depth of discharge and a 92 percent cycle efficiency, the nominal capacity is 135 / (0.9 × 0.92) = 163 kWh.
There are two more things to consider. First, allow for a 10–15 percent reserve to account for cell aging, because by the end of the warranty period, the system will be delivering less energy than it did in the first year. Second, check whether two peak events occur so close together that the storage system cannot recharge in between. With this in mind, the sizing settles at around 180 kW and roughly 185 kWh, which is a real-world figure, not a theoretical one.
C-rate and DoD: How Do They Affect the Sizing of Industrial Energy Storage Systems?
The C-rate is the ratio of power to capacity. A 1C system discharges its rated energy in one hour, while a 0.5C system does so in two hours. The 180 kW and 185 kWh from our earlier example roughly correspond to 1C.
Peak shaving applications typically operate at a discharge rate around 1C. For sharp, short peaks, a 1.5C rate may be justified, which provides a discharge window of approximately 40 minutes. For longer, flatter peaks, 0.5C is the right choice, with a two-hour window. There is no single “correct” value; the length and shape of the peak event are the deciding factors.
Ordering a higher C-rate than necessary comes at a double cost: the investment will be more expensive, and the service life will be shorter. LFP cells can achieve 6,000–8,000 cycles at 0.5C, which—at an 80 percent depth of discharge and one cycle per day—translates to a service life of more than 16 years.
The DoD indicates what percentage of the rated capacity you are actually using. The usable energy is the product of the nominal capacity and the DoD; thus, a 4,000 kWh system at a 90 percent DoD yields 3,600 kWh. Due to the flat voltage curve of LFP chemistry, it typically operates at a depth of discharge of 90–95 percent.
When sizing an industrial energy storage system, therefore, always start with the usable energy, not the nominal value listed in the catalog. Deeper discharges accelerate degradation, so peak shaving typically relies on short, targeted discharge windows: the storage system only engages when the load exceeds the threshold.
Peak Shaving with Energy Storage for Various Industrial Load Profiles
The optimal solution varies from plant to plant. The shape of the load curve determines whether a power-oriented or energy-oriented system is required. Three characteristics indicate good cost-effectiveness: a high peak-to-average ratio, predictable timing, and a technological process that cannot be rescheduled.
Sharp, short, recurring peaks. Starting large motors, welding lines, presses, production lines starting simultaneously. Here, the peak is high, but its energy content is low. Peak shaving with energy storage in this case requires a power-oriented system: high kW, moderate kWh, and a discharge rate above 1C.
Cyclic cooling load. In cold storage facilities and food processing plants, compressors and defrost cycles generate the peak load alongside a continuous base load. The timing of these peaks is highly predictable, so the EMS has time to prepare. Here, the system must be sized based on runtime, not just the peak level, because a loss of cooling causes damage to goods.
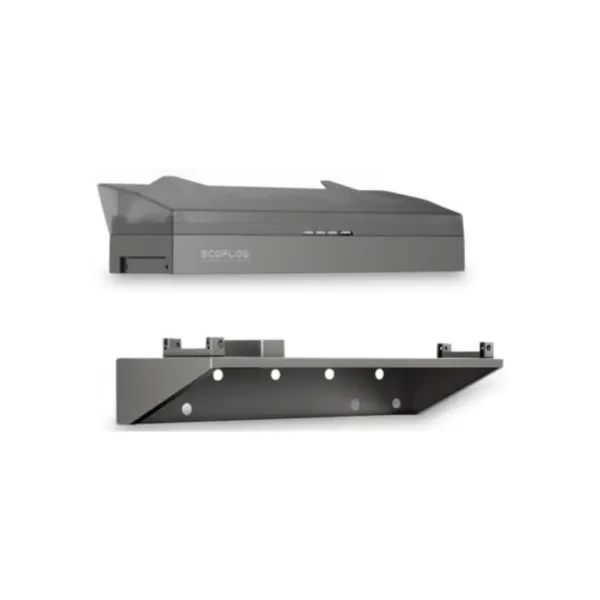
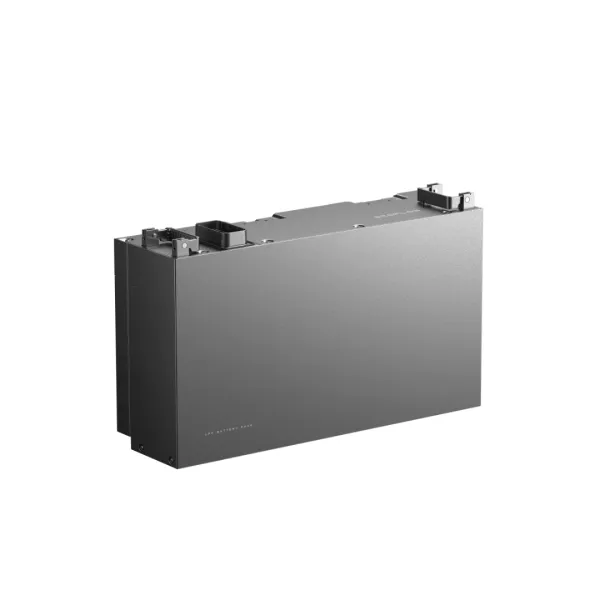
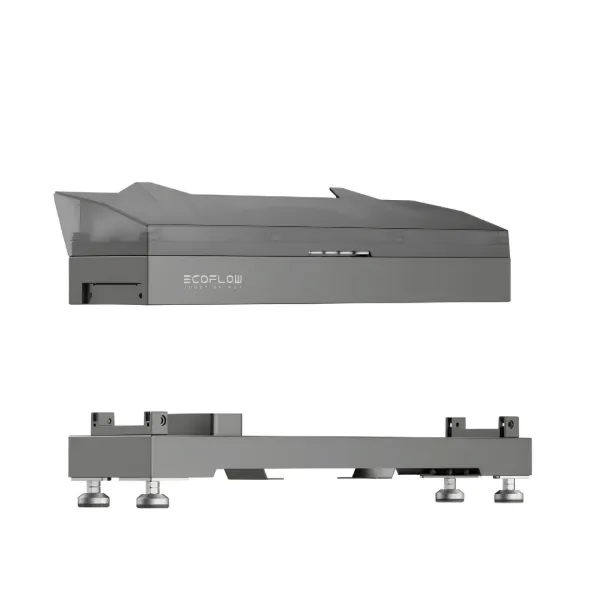
Electric fleet charging. A single 360-kW DC fast charger generates a steep peak on its own, and the simultaneous use of multiple charging points makes the load unpredictable. A battery buffer here not only reduces the power charge but can also postpone the need for transformer or connection upgrades. At smaller sites, workshops, and charging stations, a compact system—such as one of the EcoFlow energy storage models—may be sufficient.
Batch production. In chemical and pharmaceutical batch processes, the peak isn’t a matter of a few minutes but rather a longer plateau. In such cases, kWh becomes the bottleneck, and the system becomes energy-oriented, with a lower C-rate and higher capacity.
The only common factor: in every case, you must start with your own set of quarter-hourly data. A configuration that works well at another facility might even result in unnecessary overspending at yours. The characteristics of the installation site also influence the choice, from temperature to IP rating.
How much does exceeding capacity cost, and when will the investment pay off?
It’s worth distinguishing between two separate cash flows. One is the annual capacity fee paid for the contracted capacity, which you pay even if you don’t use it all. The other is the surcharge for exceeding capacity, which can hit you suddenly and hard.
Under current Hungarian regulations, if you exceed your contracted capacity without authorization, you must pay one-fourth of the annual contracted capacity fee for each kW of excess capacity used per month. If you give advance notice and the licensing authority approves it, the fee is reduced to one-tenth; however, you can request this no more than three times per contract year, for a period of one calendar month at a time. In other markets, the terminology may differ, but the logic is the same: an unreported peak is the most expensive kilowatt you’ll ever buy.
It’s worth clarifying a common misunderstanding here. The surcharge is part of the system usage fee, which is regulated by the authorities and forms part of the grid usage contract, not the commercial contract. For this reason, it doesn’t matter whether you’ve signed up for a fixed-price, formula-based, or spot-based energy tariff: the surcharge is the same. The commercial structure affects savings on the energy charge side, where storage provides an additional revenue stream alongside a spot-based contract.
For consumers with smart meters, the formula is even more direct: the distribution company’s smart meter capacity charge is based on the highest quarter-hourly average power measured during peak hours in a given month. In other words, every single month, it’s immediately visible on the bill if the storage system has reduced peak demand. There’s no annual waiting period; the effect appears on the next bill.
Reducing the peak power can thus be directly quantified in monetary terms. Take the 12-month set of quarter-hourly data, determine by how many kW you can lower the monthly maximum, multiply that by the power charge rate in your tariff, and add the avoided surcharges. If the storage system consistently keeps the threshold stable, you can also reduce your contracted capacity at the next contract renewal, which translates into permanent savings.
In terms of magnitude: according to international project experience, well-configured systems reduce capacity-based charges by 20–40 percent, typically with a payback period of 3–5 years. According to data from the U.S. NREL, capacity charges can account for as much as 30–70 percent of commercial and industrial bills. However, only your own load curve can provide the exact figure, so do not accept any peak shaving offer that is not based on it.
FoxESS TMax and TMaxPlus Industrial Energy Storage Systems for Peak Shaving Applications
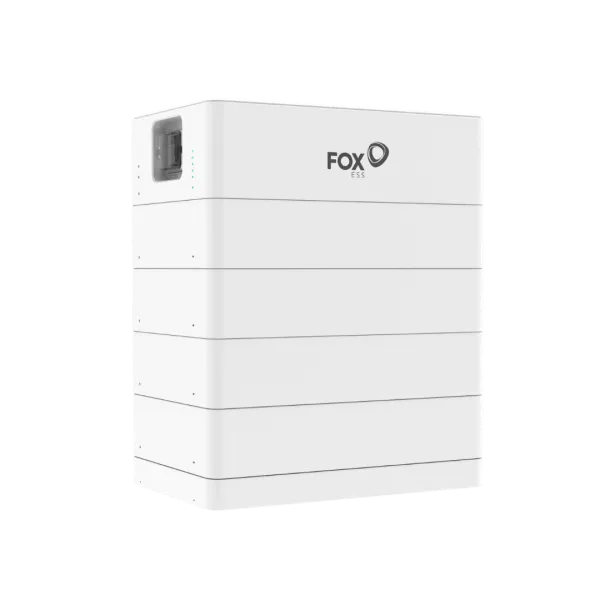
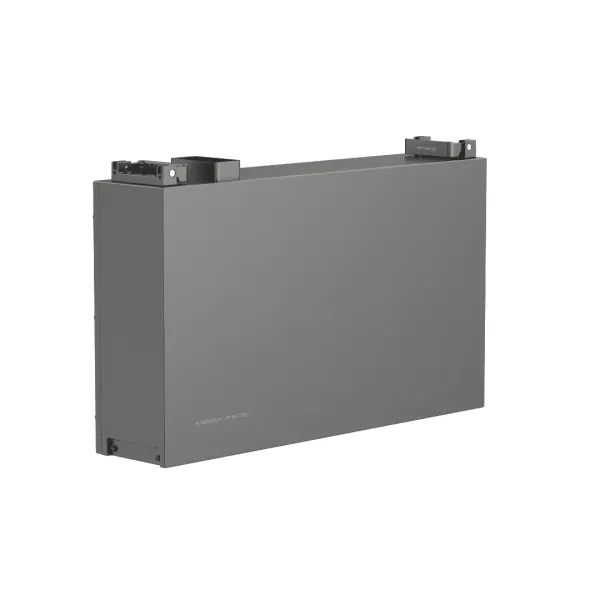
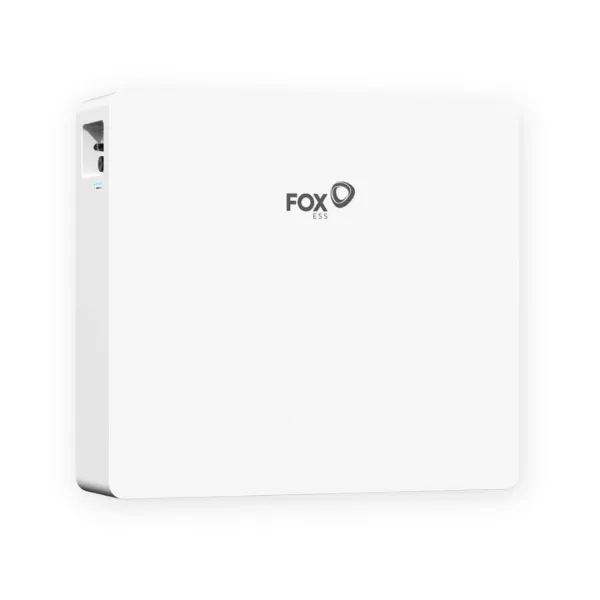
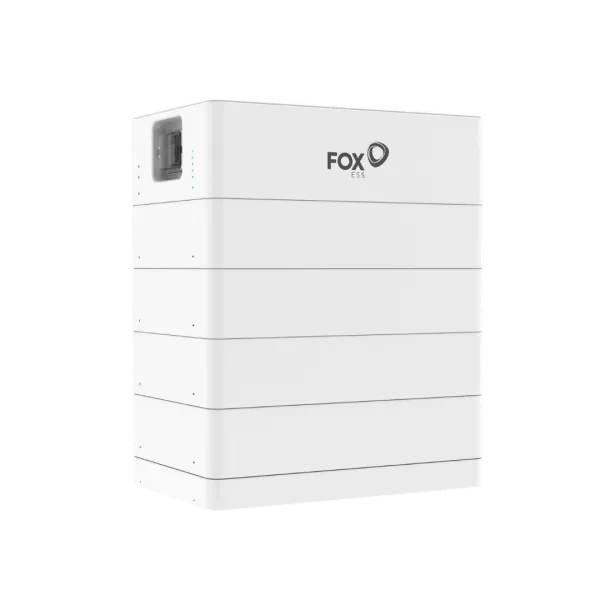
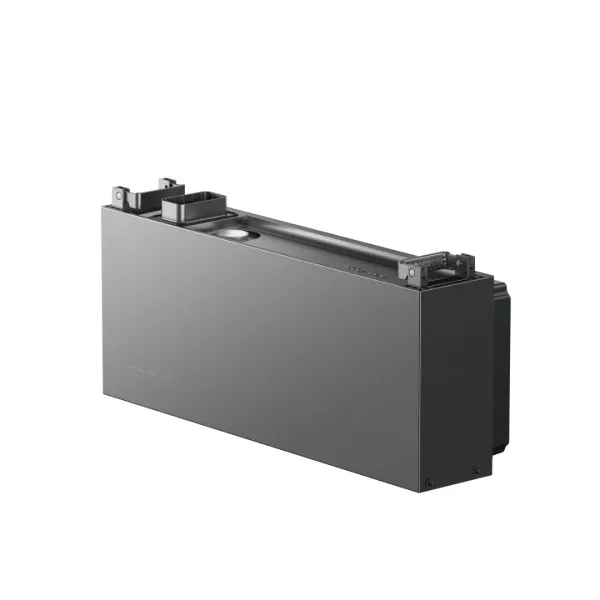
The FoxESS T-MAX and T-MAX Plus series feature a containerized, all-in-one design: the battery, PCS inverter, BMS, protection systems, and controls are all housed in a single unit. This takes a significant amount of system design work off your shoulders.
The T-MAX offers 100 kW of inverter power and 215 kWh of capacity, while the T-MAX Plus offers 125 kW and 241 kWh, with liquid cooling and built-in fire protection. The power-to-capacity ratio for both is around 0.5C, meaning these are two-hour, energy-oriented systems.
Let’s apply this to our earlier example. A single T-MAX cannot meet the 180 kW discharge demand, but two units connected in parallel provide 200 kW and 430 kWh. The power output is just enough, but the capacity is significantly higher than the required 185 kWh. This isn’t a mistake, but a matter of deliberate choice: the excess capacity provides a buffer for aging and also allows for the storage of excess solar power. However, if you only want to shave off the peak, it’s worth looking into alternatives designed for a higher C-rate.
In peak shaving mode, the system activates when the set threshold is exceeded; load shifting and backup power can also be configured, with a switching time of approximately 10 milliseconds. T-MAX and T-MAX Plus units can be configured in parallel, allowing the system to scale alongside increases in contracted power or generation capacity. You can find the available configurations in the FoxESS energy storage category.
Outdoor installation is designed with IP55 protection and liquid cooling; however, this does not mean that the installation site does not require careful consideration. The temperature range, service access, and fire safety clearances all influence the choice of location; you can read about these in detail in our article on Outdoor Energy Storage Installation. The service life of an industrial energy storage system is determined at least as much by the installation environment as by the quality of the cells. The manufacturer’s data sheet always takes precedence over category-level generalizations.
Frequently Asked Questions About Peak Shaving
What exactly does “peak shaving” mean?
Peak shaving means covering the highest peaks in power drawn from the grid using a battery, so that the meter records a lower maximum. The amount of energy consumed does not change, but the basis for the power charge does.
How much energy storage capacity is required to shave a 100 kW peak?
Two pieces of data are needed: the power to be cut and the duration of the longest peak event. Cutting a 100 kW peak during a 30-minute event requires 50 kWh of useful energy, which—at a 90 percent depth of discharge (DoD) and 92 percent efficiency—corresponds to a nominal capacity of roughly 60 kWh.
How long does it take for a peak shaving system to pay for itself?
According to international project data, well-configured systems pay for themselves in 3–5 years, with a 20–40 percent reduction in power charges. The actual figure depends on your specific rate plan and the shape of your load curve, so the payback period should always be calculated based on your measured data.
Does peak shaving work without solar panels?
Yes. Battery-based peak shaving works even without solar panels; in this case, the battery charges from the grid during periods of low demand. Solar panel generation adds the benefit of making charging cheaper and providing additional savings on your electricity bill.
Is one month’s worth of consumption data sufficient for sizing?
No. One month’s data hides seasonal peaks, such as summer cooling or winter heating loads. At least 12 months of quarter-hourly data is required; otherwise, the system will be undersized during the month when a failure would be most costly.